Reading Time: 11 minutes
We value what we can measure. In law libraries, that means we sometimes value only a subset of what is actually valuable in our organizations. But metrics can help you to show funders and decision-makers like governance boards your impact. Web-based metrics may be a growing part of the measurements we use, as physical metrics—foot traffic, in-library use of books—may be declining or remain causally distanced from the data. Perhaps the most common web analytics tool is Google Analytics which, while invasive for your users, can provide a lot of useful data. Google Analytics is transitioning to version 4 (aka GA4), which gave me an opportunity to look at all of the tools I’m using to measure web activity.
Your web site is in the middle of this flow. And you have a couple of options if you are not comfortable playing entirely in Google’s universe. On the front end, you have search console tools that ensure your web site is being indexed by search engines. They will warn you whether your site has usability or indexing problems. On the back end, you have the analytics tool. It is fair to say that all of these analytics tools rely on visitors having javascript enabled. When they hit your web page—website, catalog, Libguides, etc.—and the page loads the javascript, their activity and identifying information is recorded.
You want to make sure your web site is being found by search engines that, in most cases, will drive the most activity on your web pages. Even if you are successfully using event (Eventbrite, Wild Apricot) or email distribution tools (MailChimp, Constant Contact), your direct and organic web traffic is probably smaller than your search engine-driven traffic. You want to be able to measure that activity on the other end, to see what is working and what isn’t.
You may already be using Google Analytics. If so, make sure you have plans to migrate to GA4. The old version’s data will stop being collected on July 1, 2023. The data cannot be migrated forward to the new version. If you are not using it and are considering it, it’s easy to start from scratch.
Search Consoles
I use both the Google Search Console and Bing’s Webmaster console. Both are free. They are where you can see how your web site performs in their search engine results: how often your site appears in searches, how often people click through (which you may also see in your analytics), and what keywords drive people to your site. If you only use one, use Google’s because their search engine has greater impact on your site.
One thing I like about the search consoles is that you can use any analytics package you want. They are completely separate. The search consoles do not show you any information or capture any information about your visitors activity. It’s all front end information.
Tip: if you are going to use Bing Webmaster and Google Search Console, create your Search Console account first. You will need to go through site verifications for your site, and this can reduce the number of verifications you have to do. Bing Webmaster will import a Google Search Console account. Also, if you’re using Google Search Console and Google Analytics, you can link those two together as well.
It can help you to ensure that you have configured your web site so it’s accessible to search engines. For example, there are tools to test your robots.txt file and, as importantly, tell you if you don’t have one. There are tools to import site maps, which allow a search engine to be directed to the content you want to be indexed, rather than relying on the search engine to just crawl from page to page and potentially miss something.

One thing I like about the search console is that it can help you anticipate if you are going to have problems with search. If you appear less frequently in search results, your web traffic may fall. If you report your website visits to your dean or managing partner, you will want to know why you are experiencing a downward trend. Using the search console can help you anticipate those drops and mitigate them before they happen.

The consoles will tell you the specific pages that are impacted, so that you can return to your website and you or the person responsible can fix them. Some warnings may highlight things that you don’t want to change, in which case it just highlights the impact of choices you have made on your websites.
I particularly like knowing that I can use site maps. If you have been around as long as I have—coding web pages since the mid-1990s—then these may not be the site maps you are thinking of. In Web 1.0, it was common to find a page on a website that showed the entire website hierarchy, and those pages were called site maps. That’s not what we’re talking about now.
Modern site maps are XML files and tend to be generated by the web app we are using. If it’s a WordPress site, you can often find one by just appending /sitemap.xml to the website URL: https://ofaolain.com/sitemap.xml. The same thing for Springshare LibGuides, whether your institution hosts them or not. Add a /sitemap.xml to the main URL and you should see a page full of URLs and dates. Here’s the site map for the American Library Association’s LibGuides, found at https://libguides.ala.org/sitemap.xml:

You do not need to understand any of that site map’s information. In your search console, you will just add the URL for the site map and the search engine will take care of the rest. But if you’ve ever worried whether your website content is being indexed, this is one way to be sure.
One other thing to mention. You need a Google account to use Google Search Console or Google Analytics. You will need a Microsoft account to use Bing Webmaster or Clarity, another Microsoft tool I mention below. All four can be used by teams of people. This can be useful if you have (a) managers who want direct access to data to run their own reports or (b) staff who want to get exposed to this type of technology but who have not yet got the accountability for it. Your website staff can still maintain responsibility but they don’t need to be the only people with access.
Web Site Analytics
I won’t waste your time on what web site analytics are. I use Matomo, an open source website analytics application, for this and other websites I run for my personal use. I host it myself so any metrics about my visitors remain on my websites. For a few months, I’ve also been running Microsoft’s Clarity and Google Analytics 4. I’ll be removing them once I’m done with this blog post. They are fine for an organizational website but I don’t have any need for their information.
I won’t dip into Matomo. I’ve blogged about it here and it’s great. It’s easy to use and easy to implement especially if your web host supports Softaculous. I would not recommend the Matomo WordPress plugin unless you can’t install the full product.
You implement both of them in pretty much the same way. They both have javascript code that you drop into your website code. How you do that will depend on your web app. In WordPress, I put it in the footer template for my theme. You can also use plugins that allow you to paste the code in from your dashboard.
Springshare LibGuides approach is like the WordPress plugin approach. Go to your system settings and access the Custom Analytics tab. You can choose whether to place it in the header of your site or the footer. Note: when you do the site verification process for analytics or the search console, the verification code needs to be Within <HEAD> tag.
You may already be capturing your web app’s analytics using a built-in tool. For WordPress, I have Automattic’s JetPack and it captures visitor data. If that’s all you have, that’s fine. It’s pretty weak as an analytics tool though, more of just a stats gatherer. But you will find that your analytics package, whether Matomo or Google or whatever, may have different data from that captured by JetPack. If you are measuring multiple web apps—your website, your catalog, your LibGuides—then having all of them tracked with the same tool can create increased certainty around the data.
Google Analytics 4
I dropped the old Google Analytics a while ago when I switched to Matomo so I can’t use it for any before and after comparisons. I don’t have any data remaining. But I created a Google Analytics 4 property and then added data streams to it. For the most part, it feels the same but things are in different places.
If you, like me, are making the switch from an old Google Analytics property to a new one, the easiest thing to do is open your old GA property. There will be a warning at the top and a link to a Setup Assistant. This will walk you through the process of creating the new Google Analytics 4 property. There is also a GA4 Setup Assistant inside your old analytics administration panel. You can also do it manually, by creating a new account or, if you have one, just creating a new property below it.
That’s a lot of technical terms. The most important place in the administration panel is to navigate to your account, then your property, and find Data Streams. This replaces the Tracking Info option in the older Google Analytics.
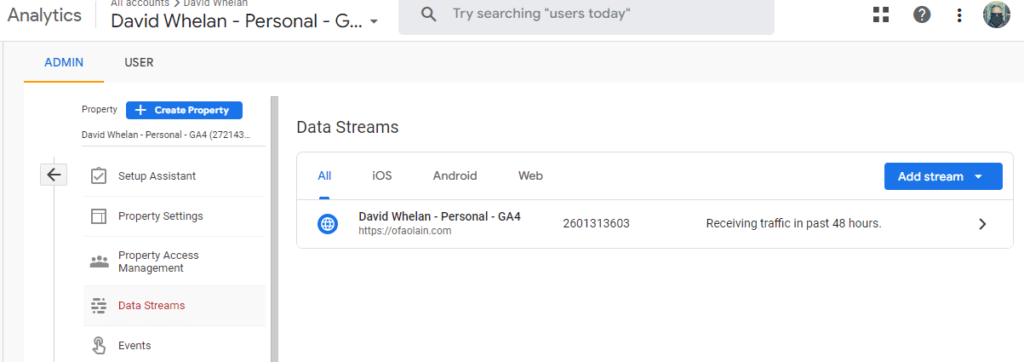
You can have multiple data streams here. Each one has its own code. So, if you are running a law library and want to track multiple sites, you can have a different stream for each one. Our library has three: one for the website, one for the catalog, and one for LibgGiudes. In that way, you can manage users and reports from within one account.
In general, with either Microsoft or Google or Matomo or probably any analytics package, you just drop the javascript into your web page and you’re all set. But what if you use a web app that pulls in analytics with javascript itself? We ran into this with our library catalog, which loads custom javascript in a file called opac.js. The Google Analytics code—or tag, as it’s called—needs to be rewritten so the external javascript can load it.
The normal code looks like this. I’m replacing my Google tag for G-xxxxxxxxxx so that it’s clear where you should put your tag. It’s not secret; you can view source for a web page and see the tag.
<!-- Google tag (gtag.js) -->
<script async
       src="https://www.googletagmanager.com/gtag/js?id=G-xxxxxxxxxx">
</script>
<script>
  window.dataLayer = window.dataLayer || [];
  function gtag(){dataLayer.push(arguments);}
  gtag('js', new Date());
  gtag('config', 'G-xxxxxxxxxx');
</script>
The difficulty comes when you try to call that first script from the googletagmanager.com URL. If you are putting your Google Analytics javascript inside another javascript, you need to rework it. A sharp-eyed colleague at our law library found the solution. You can paste the following code into another javascript and it will register Google Analytics traffic.
// Google tag (gtag.js)
// Call the external javascript, replacing first tag code script
let d = document
    , s = d.createElement('script')
    , t = d.getElementsByTagName('script')[0];
s.async = 1
s.src = 'https://www.googletagmanager.com/gtag/js?id=G-xxxxxxxxxx'
t.parentNode.insertBefore(s, t)
// invoke the second tag code script
window.dataLayer = window.dataLayer || [];
function gtag(){dataLayer.push(arguments);}
gtag('js', new Date());
gtag('config', 'G-xxxxxxxxxx');
The new Google Analytics seems much better to me than the old version. You can more easily customize what you are measuring—how much privacy you invade—in the data stream customizer. You can see if there is a problem with data collection more visibly than in the past.
We use a number of urchin tracking codes, like utm_source, to help segment website conversions based on different advertising or activities we engage in. We can still see those coming in and segment them using the source/medium filters.
I was glad to see that behavior flow is also still easy to find. It seems less customizable than the old version—where I could limit the sessions I was watching by the urchin tracking codes—but I expect it’s just that I haven’t found the function, rather than that the function doesn’t exist any longer.

Microsoft Clarity
Microsoft’s Clarity product isn’t a typical analytics tool. It’s billed as a free heatmaps and session recording tool. It’s not where I would go if I was trying to pull together a “visits and pageviews” report, although I find that those don’t have a whole lot of utility anyway. Clarity is useful for seeing how people are interacting with your website. Like the Google Analytics path exploration or behavioral flow charts, you can see what people are doing, as opposed to just random clicks.
I haven’t explored it very heavily but it has some interesting features that I have not used on Google Analytics. One I like is the heat map, which shows where people are interacting with your site. Like Google Analytics, there’s a real-time mode so you can watch a visitor as they are interacting with your site.
Microsoft Clarity is not capturing all website traffic. It’s not going to be a reporting tool like another analytics tool. It actually makes a lot of sense to me that Microsoft didn’t try to create its own free analytics tool. They have a commercial analytics tool for ad buyers. I’m barely interested in tracking people with free tools, let alone using advertising management tools. There are plenty of free tools and Google Analytics seems likely to continue to dominate the space, like its search engine and ad business do in theirs.
An Analytics Caution, Part 1
Google Analytics and Microsoft Clarity are trackers. As more people block trackers, they may be blocking your analytics code. I assume website analytics data is soft these days. They’re a guideline but they’re not sufficiently representative as to make me think of them as highly accurate.
I use the EFF’s Privacy Badger to block trackers as well as NoScript, a javascript blocker. When I visit web sites using Google Analytics, Google Tag Manager, or DoubleClick—Google’s three analytics tracking URLs—my activity is blocked. One benefit of running your own, hosted analytics like Matomo is that it can’t be blocked because they’d have to block your website functionality.
One concern I have is that ad and tracker blocking can be harder on mobile devices. This could lead to more mobile visits being registered than desktop visitors who are actively blocking scripts. This could lead to a more mobile-centric resource delivery approach that may not be warranted.
You want to use analytics to help you decide how to apply resources: what LibGuides to create or toss, what web events are popular and which aren’t. But using them as a value metric—our visits are up or down—lacks nuance and doesn’t necessarily provide useful information. It can lead people to poor decisions by looking at a limited perspective of value.
An Analytics Caution, Part II
This is more practical. Analytics use javascripts. Javascripts can slow your website speed down. One reason the Google Analytics 4 tag has an async descriptor is to ensure it loads as efficiently as possible. If you aren’t already, run your website or LibGuides site through Google’s PageSpeed tool.
PageSpeed will give you some useful information about what is hindering your page’s efficient loading. You may be losing visitors if your site takes too long to load. In particular, you can learn if it’s slower on mobile devices, if that’s something you care about, than it is on desktop devices. For awhile I attempted to participate in Google’s Accelerated Mobile Pages (AMP) project but (a) I don’t get a lot of mobile visitors and (b) my AMP implementation always seemed to slow down the content. Fortunately, even Google has deprecated AMP as a page rank measurement.
I use the free version of WP-Optimize WordPress plugin and was able to improve my performance with some minor tweaks related to javascript loading. You do not need to have much technical knowledge but it can take some trial-and-error to ensure that you are loading only those things asynchronously that won’t break your website.

I spend way too much time on web analytics for my hobby website. But it’s an easy place to stretch your understanding of what’s going on under-the-hood of most of the internet. As you refine your analytics and search results approach, you may, like me, pick up a bunch of incremental knowledge!