
In 1990, 13.04% of the Court’s criminal cases had one dissenter. Two dissenter cases were 5.8% and only 1.45% had three. In 1991, one dissenter cases were again the most common divided criminal decision. In 1992, 10.87% were two dissenter cases; only 5.43% had one and 1.07% had three. In 1993, 9.3% had one dissenter, 2.33% had two and 4.65% had three. In 1994, 12.31% had one dissenter, 15.38% had two dissenters and 10.77% had three. In 1995, 13.92% had one dissenter, 17.72% had two and 8.86% had three. In 1996, 14.81% had two dissenters, 9.26% had three and 7.41% had one. In 1997, 17.46% had three dissenters, 12.7% had one and 9.52% had two. In 1998, 12.5% of the criminal decisions had one dissenter, 8.33% had two and 9.72% had three. In 1999, fully 35.85% had one dissenter, 9.43% had two and 9.43% had three.

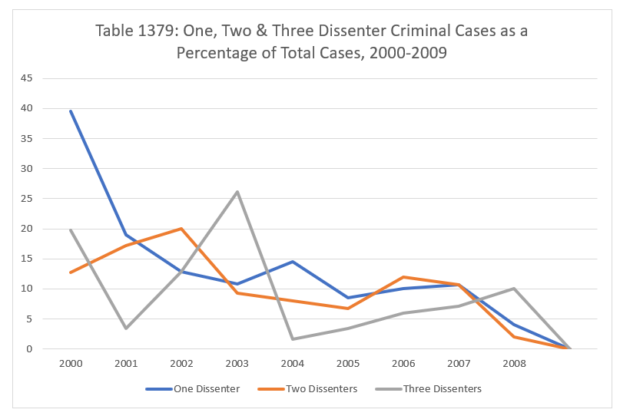
Between 2000 and 2007, the rate of one dissenter cases was over ten percent every year but one: 39.53% (2000), 18.97% (2001), 12.86% (2002), 10.77% (2003), 14.52% (2004), 8.47% (2005), 10% (2006) and 10.71% (2007). Two dissenter cases were in double figures in five of those eight years: 12.79% (2000), 17.24% (2001), 20% (2002), 9.23% (2003), 8.06% (2004), 6.78% (2005), 12% (2006) and 10.71% (2007). Three dissenter cases were in double figures only three times: 19.77% (2000), 3.44% (2001), 12.86% (2002), 26.15% (2003), 1.61% (2004), 3.39% (2005), 6% (2006) and 7.14% (2007). In 2008, only 4% of the Court’s criminal cases had one dissenter and 2% had two. Ten percent of the Court’s cases had three dissenters. In 2009, 9.62% had two dissenters, 7.69% had three and only 5.77% had one.
In the past decade, one dissenter criminal cases have been comparatively less common than two and three dissenter cases (combined). In 2010, 12.73% had two dissenters, 3.64% had three and 9.09% had one. In 2011, 12.5% had three dissenters, 10.42% had two and no criminal case had one dissenter. In 2012, 9.09% had two dissenters, 9.09% had three and 12.12% had one. In 2013, one and two dissenter cases were equal at 13.16%; there were no three dissenter decisions. In 2014, 8.82% had two dissenters, 5.88% had three and 5.88% had one. In 2015, all three types of non-unanimous decisions were equal: 6.06% one dissenter, 6.06% two dissenters and 6.06% three dissenters. In 2016, two dissenter cases were 8.57% and both one and three dissenter cases were 5.71%. In 2017, one dissenter cases were more common: 14.71% (one dissenter), 8.57% (two) and 5.71% (three). In 2018, 15.38% of the criminal cases had two dissenters, 7.69% had three and 3.85% had one. So far in 2019, two and three dissenter cases have been an equal share of the criminal decisions: 18.75%. There have been no one-dissenter criminal cases.

Join us back here next week as we address a new issue.
Image courtesy of Flickr by UW News (no changes).